Last month, the CDFI Fund awarded $7 billion in NMTC allocation. Where will that allocation be deployed? We have a decent idea, thanks to new data on state targeting from the CDFI Fund.
Heatmap of 2015/2016 Allocation Targeting
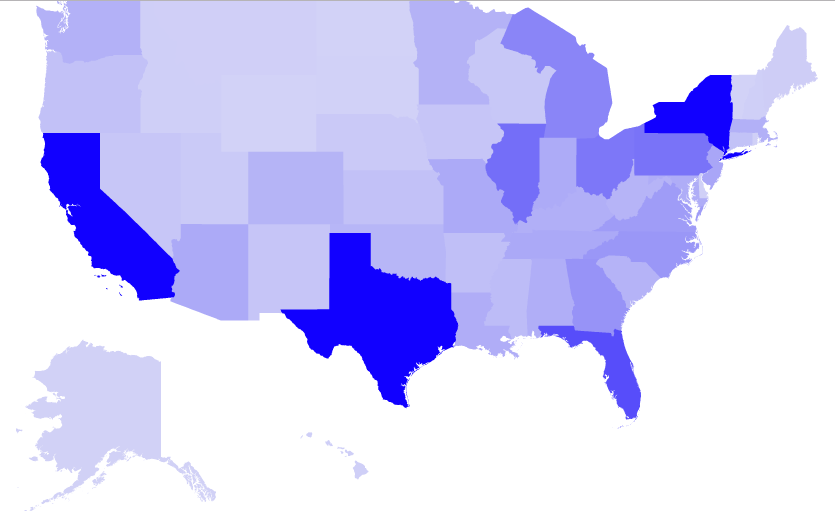
The heatmap above shows where CDEs are targeting their 2015/2016 allocation. But it tells a misleading story, with high population states receiving more NMTC allocation.
Rather than adjusting on a per capita basis, instead, I divided targeted amount of NMTC allocation by the number of NMTC eligible census tracts in a state (download the full dataset). That produces this reweighted heatmap.
Adjusted Heatmap – States Targeted by 2015/2016 NMTC Allocation Round

In the adjusted map, you can see that the top states are Arkansas, Hawaii, Idaho, Montana, Nevada, and Wisconsin. In fact, we project that Wisconsin will receive more than a million dollars per eligible census tract.
The Top Ten States
| State | Estimated amount targeted by 2016 round award recipients | NMTC Eligible Census tracts | 2016 NMTC allocation per eligible census tract |
| Wisconsin | $231,601,190 | 209 | $1,108,140 |
| Montana | $62,857,143 | 84 | $748,299 |
| Hawaii | $65,714,286 | 93 | $706,605 |
| Nevada | $133,892,857 | 212 | $631,570 |
| Idaho | $55,714,286 | 90 | $619,048 |
| Arkansas | $185,904,762 | 315 | $590,174 |
| Vermont | $24,166,667 | 44 | $549,242 |
| Iowa | $114,428,571 | 225 | $508,571 |
| Oregon | $ 129,928,571 | 293 | $443,442 |
| Indiana | $255,648,810 | 607 | $421,168 |